I came up with this term last week, during a presentation by Bill Lay at the Masters Summit for QlikView in London.
Low-cardinality part-to-whole comparison
For me, it perfectly describes the correct use of a pie chart. Let's break it down:
Low-cardinality
In database parlance, this means that a column has few unique values. For example, a flag field - either 1 or 0 - has only 2 unique values. An opposite example, high-cardinality, might be Account Number - lots of unique values.
In a pie chart, for me, this means that you need to have a low number of segments. Really only two or three. Too many segments makes it hard to discern the differences between them.
Part-to-whole
This is critical for the correct use of a pie chart. A pie chart is all about ratio - while you are comparing a segment against other segments, the correct context is the size of the segments versus the whole - what is the ratio of one segment versus the others and against the whole.
As an example, if we are looking at sales by country and look at only 3 countries - say Germany, USA and France. In a pie chart we might see that Germany has about half of the sales. But the context is just the sales of 3 countries and you can come to the incorrect conclusion that Germany is responsible for half of sales. Showing all of the sales for all countries - probably restricting to Germany and Others or Germany, USA, France and Others - then we see the whole picture.
If we just want to compare the size of one country's sales versus other countries, then a bar chart is ideal. The bar chart also works if you can't see all of the countries. If you only present a sub-set of the countries in a pie chart, the context is incorrect.
So, there you go - low-cardinality part-to-whole comparison. Feel free to use it in your next presentation.
Stephen Redmond is author of QlikView for Developer's Cookbook
He is CTO of CapricornVentis a
QlikView Elite Partner. We are always looking for the right people to join our team.
Follow me on Twitter: @stephencredmond
Wednesday 16 October 2013
Tuesday 15 October 2013
Packt Columbus Day Sale
Packt are offering 50% off all eBooks for Columbus Day.
Good opportunity to grab the QlikView Developers Cookbook or the QlikView 11 for Developers in eBook:
Packt - Columbus Day 2014
Stephen Redmond is author of QlikView for Developer's Cookbook
He is CTO of CapricornVentis a QlikView Elite Partner. We are always looking for the right people to join our team.
Follow me on Twitter: @stephencredmond
Friday 11 October 2013
Bucket analysis by copying states
Alternate States were introduced in QlikView 11. This allows different objects to be in different selection states.
You can have, for example, 2 list boxes, both with the same field, and both with a different set of selections.
One of the things that this enables a whole new way of "bucket" analysis - allow a user to compare the values from one set of selections against any other set of selections that they may want to make. It is incredibly powerful.
Many examples that I have seen will have two or three list boxes in each state, side by side, and some chart or set of charts displaying the results. The reason that you might have only two or three list boxes is really a practical one - there is only so much space on the screen.
My own solution to this is to put the sets of list boxes into containers. You can then fit many more list boxes for your side-by-side comparison. However, what if you want to have more than two sets? If I want to have, say, 4 states that I want to compare then it becomes more difficult to display those and still leave space for the charts.
You can, of course, do some funky stuff with hiding and showing different sets based on a click of a button. This can be a little confusing so I want to suggest a simpler approach.
Along with the Alternate States came a couple of new Actions - Swap State Contents and Copy State Contents. So, my approach is to have only one set of selections, that are in either their own State or event the default state, and make my selections in these. I can then have a button to Copy State Contents from the list boxes to the State that I want them in.
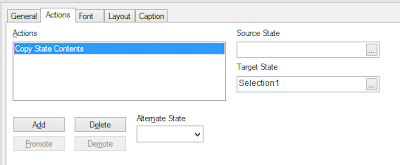
The screen shot shows the Action setup to copy the state contents from the "Default" state (blank) to a state that I have setup called "Selection1".
I would have this action attached to a button called "Save Selection 1" (or something that will make sense to my users) and then have some charts that will show this versus Selection2, Selection3, etc.
To extend a model that uses Show/Hide boxes means having to do quite a bit of work. To extend this model means adding one new button.
Stephen Redmond is author of QlikView for Developer's Cookbook
He is CTO of CapricornVentis a QlikView Elite Partner. We are always looking for the right people to join our team.
Follow me on Twitter: @stephencredmond
Thursday 10 October 2013
Flags and Dual values in Set Analysis
To avoid having to create very complex Set Analysis, it can be quite a good idea to create flags in your script. Doing the complex calculation in the script to create a simple 1 or 0 value means it happens once - when your users are not involved - and makes the front end calculations a lot quicker - when your users are involved.
Sometimes we want to dual-purpose that flag field. As well as having the value of 1 or 0, we want to allow the users to select the field. "1" and "0" are not very friendly so we want to have the users click on something like "Yes"/"No" or "True"/"False". There are a few ways of achieving this:
1. Just create the 1 or 0 in the script and in the front-end use an Expression in the list box like:
If(Flag=1, 'True', 'False')
This works fine but, of course, is putting some calculation back into the front-end. While it is not an arduous calculation, it will re-calculate on all selections so it does add some clock cycles. It also makes no impact on how you would use the value in Set Analysis so I don't need to worry about this option any further in this post.
2. Create the 1 or 0 in the Flag field and create a 2nd field (e.g. Flag_Text) with the text values that you want. The user gets to select the value from Flag_Text, but we use the Flag value in Set Expressions.
There are a couple of issues with this. First off, it adds additional overhead in the Script because we need to do the same calculation twice and create 2 fields. Secondly, if we use the Flag value in a Set, we need to ensure that we also exclude the Flag_Text value from that set:
Sum({<Flag={1}, Flag_Text=>} Sales)
There is also the possibility that a user using collaboration features might add the Flag field as a list box and that might cause confusion.
3. Instead of creating the values as 1 or 0, we create Dual values:
...
If(Condition=True, Dual('Yes',1), Dual('No',0)) As Flag,
...
This is more efficient because everything happens in the script and we are only creating the one field there from one piece of code.
There is a complication though in your Set Analysis. You would like to do something like this:
Sum({<Flag={1}>} Sales)
But it will now fail! This is because the set comparison always compares against the text value of a dual (except for Dates - more of that below). That means that you would have to use:
Sum({<Flag={'Yes'}>} Sales)
Of course, this is a text comparison so will not execute as efficiently as a numeric one. What can we do?
Well, we can force the calculation to be numeric by using a search syntax instead of the actual value and that search should involve > or <. For example:
Sum({<Flag={">0"}>} Sales)
Will work!
Interestingly, this does not work immediately with a date value that has been created with one of the date functions (like Date(), MakeDate, etc.) I am not totally sure of why but I suspect that this is handled differently because the system recognizes it as a date (so it understands what ">2/6/2013" means) and doesn't handle the same way as other numeric Duals.
This means that we often need to add formatting into a date set to get it to work. Like this:
Sum({<Date={$(=Date(vDate,'M/D/YYYY'))}>} Sales)
We can override this and make our dates handle like other Duals by loading them as a Dual explicitly in the Script. Instead of this:
...
Date(date_field) As Date,
...
We can do this:
...
Dual(Date(date_field), Num(date_field)) As Date,
...
Have fun!
Stephen Redmond is author of QlikView for Developer's Cookbook
He is CTO of CapricornVentis a QlikView Elite Partner. We are always looking for the right people to join our team.
Follow me on Twitter: @stephencredmond
Subscribe to:
Posts (Atom)