This is a good function to have around and one that is useful to demonstrate being able to have optional parameters in functions. We just need to check that a parameter is not nil. If it is, we can set a default value.
Here is the code:
function inyeartodate(vdate, vbasedate, vshift)
-- Accept a date and compare it to the base date
-- If it is in the same year up to and including the
-- basedate, then true. The shift changes the
-- year to compare. E.g. -1 is YTD last year.
rval = 0
-- The parameters may not have been passed so establish defaults
if vdate == nil or not is.datetime(vdate) then vdate = datetime.timestamp() end
if vbasedate == nil or not is.datetime(vbasedate) then vbasedate = datetime.timestamp() end
if vshift == nil or not is.number(vshift) then vshift = 0 end
-- In case the shift is not an integer, floor it
if not is.integer(vshift) then vshift = math.floor(vshift) end
-- If the vshift is not zero, we ajust the base date
if vshift ~= 0 then vbasedate = datetime.adjust(vbasedate, vshift, "y", true) end
-- If the vdate is less than the base date,
-- and they are in the same year, then
-- the result is true - return -1
if vdate <= vbasedate and datetime.moment(vdate, "y") == datetime.moment(vbasedate, "y") then
rval = -1
end
return rval
end
And you might call it like:
d = string.datetime("20120514", "CCYYMMDD")
b = string.datetime("20130531", "CCYYMMDD")
print (inyeartodate(d))
print (inyeartodate(d, b, -1))
Another interesting thing to note is the "true" parameter to the datetime.adjust function. This causes the function to use 365 days in the calculation rather than 365.25.
Stephen Redmond is CTO of CapricornVentis a
QlikView Elite Partner. We are always looking for the right people to join our team.
Follow me on Twitter: @stephencredmond
Monday 13 May 2013
Month function in Lua for QlikView Expressor
Lua doesn't have a Dual data type like QlikView's. However, it does have a native Table data type that could allow us to simulate a Dual. At the end of the day, you are still going to have to the different values as separate outputs, but it could be useful to have a simple function that will give you one or the other.
Here you go:
function month(vdate)
rval = nil
-- Set up a table of Month names
local months = {"Jan", "Feb", "Mar", "Apr", "May", "Jun", "Jul", "Aug", "Sep", "Oct", "Nov", "Dec"}
if is.datetime(vdate) then
-- Get the month number using datetime.moment
local monthnum = datetime.moment(vdate, "m")
-- Return a table of the Text and Num values
rval = {Text = months[monthnum], Num = monthnum}
end
return rval
end
This would be called something like this:
d = string.datetime("20130513", "CCYYMMDD")
print (month(d).Text, month(d).Num)
Enjoy.
Stephen Redmond is CTO of CapricornVentis a QlikView Elite Partner. We are always looking for the right people to join our team.
Follow me on Twitter: @stephencredmond
Here you go:
function month(vdate)
rval = nil
-- Set up a table of Month names
local months = {"Jan", "Feb", "Mar", "Apr", "May", "Jun", "Jul", "Aug", "Sep", "Oct", "Nov", "Dec"}
if is.datetime(vdate) then
-- Get the month number using datetime.moment
local monthnum = datetime.moment(vdate, "m")
-- Return a table of the Text and Num values
rval = {Text = months[monthnum], Num = monthnum}
end
return rval
end
d = string.datetime("20130513", "CCYYMMDD")
print (month(d).Text, month(d).Num)
Stephen Redmond is CTO of CapricornVentis a QlikView Elite Partner. We are always looking for the right people to join our team.
Follow me on Twitter: @stephencredmond
AddMonths function in QlikView Expressor
QlikView Expressor comes with a programming language, called Lua, to which they have added their own objects and functions. One of these is the datetime object which has several functions to allow the manipulation and parsing of dates - something that will be done in an ETL environment quite frequently.
One of these function is adjust - used to add or subtract different time periods from a date. When looking at the documentation, there was an interesting, to me anyway, omission in the type of period that you can adjust a date by. It does include seconds, minutes, hours, days, years and centuries, but no months!
Now, month arithmetic should be straightforward but there are complications when you have dates after the 28th of any month - what happens if you subtract 3 months from the 29th May 2013? If you don't handle it correctly, you will get an invalid date.
In this Lua function, I handle that eventuality by using a Lua pcall function to test if the returned date is valid and, if not, subtracting a day until it is.
function AddMonths(dt, months)
-- Parse the month, year and day of the date
mn = datetime.moment(dt, "m")
yr = datetime.moment(dt, "y")
dy = datetime.moment(dt, "d")
-- Add the number of months to the month
mn = mn + months
-- If this resulted in a month value over 12,
-- then we increment the number of years and
-- decrease the month value by 12 until it is
-- less than 12 again
while mn > 12 do
mn = mn - 12
yr = yr + 1
end
-- Similarly, if the calculation leaves us
-- less than zero, we need to subtract years
while mn < 1 do
mn = mn + 12
yr = yr - 1
end
-- If the day value is over 28, the convert might not parse so we drop the number
-- of days until it does (e.g. starting with 31st May, subtract 3 months gives
-- Feb - 31st Feb is an error so we need to go back to 28th Feb)
if dy > 28 then
-- Wrap the call in a pcall() to test if it works - if it fails, we subtract a day
while not pcall(function() string.datetime(mn .. "/" .. dy .. "/" .. yr, 'M*/D*/YYYY') end) do
dy = dy -1
end
rval = string.datetime(mn .. "/" .. dy .. "/" .. yr, "M*/D*/YYYY")
else
rval = string.datetime(mn .. "/" .. dy .. "/" .. yr, "M*/D*/YYYY")
end
return (rval)
end
So, you would call it something like this:
bd = string.datetime("20130529", "YYYYMMDD")
print(datetime.string(AddMonths(bd, -3), "CCYY-MM-DD"))
This may not be be most efficient way to do this, but it is a useful demonstration of using pcall and doing month arithmetic.
Stephen Redmond is CTO of CapricornVentis a QlikView Elite Partner. We are always looking for the right people to join our team.
Follow me on Twitter: @stephencredmond
One of these function is adjust - used to add or subtract different time periods from a date. When looking at the documentation, there was an interesting, to me anyway, omission in the type of period that you can adjust a date by. It does include seconds, minutes, hours, days, years and centuries, but no months!
Now, month arithmetic should be straightforward but there are complications when you have dates after the 28th of any month - what happens if you subtract 3 months from the 29th May 2013? If you don't handle it correctly, you will get an invalid date.
In this Lua function, I handle that eventuality by using a Lua pcall function to test if the returned date is valid and, if not, subtracting a day until it is.
function AddMonths(dt, months)
-- Parse the month, year and day of the date
mn = datetime.moment(dt, "m")
yr = datetime.moment(dt, "y")
dy = datetime.moment(dt, "d")
-- Add the number of months to the month
mn = mn + months
-- If this resulted in a month value over 12,
-- then we increment the number of years and
-- decrease the month value by 12 until it is
-- less than 12 again
while mn > 12 do
mn = mn - 12
yr = yr + 1
end
-- Similarly, if the calculation leaves us
-- less than zero, we need to subtract years
while mn < 1 do
mn = mn + 12
yr = yr - 1
end
-- If the day value is over 28, the convert might not parse so we drop the number
-- of days until it does (e.g. starting with 31st May, subtract 3 months gives
-- Feb - 31st Feb is an error so we need to go back to 28th Feb)
if dy > 28 then
-- Wrap the call in a pcall() to test if it works - if it fails, we subtract a day
while not pcall(function() string.datetime(mn .. "/" .. dy .. "/" .. yr, 'M*/D*/YYYY') end) do
dy = dy -1
end
rval = string.datetime(mn .. "/" .. dy .. "/" .. yr, "M*/D*/YYYY")
else
rval = string.datetime(mn .. "/" .. dy .. "/" .. yr, "M*/D*/YYYY")
end
return (rval)
end
bd = string.datetime("20130529", "YYYYMMDD")
print(datetime.string(AddMonths(bd, -3), "CCYY-MM-DD"))
This may not be be most efficient way to do this, but it is a useful demonstration of using pcall and doing month arithmetic.
Stephen Redmond is CTO of CapricornVentis a QlikView Elite Partner. We are always looking for the right people to join our team.
Follow me on Twitter: @stephencredmond
Wednesday 1 May 2013
Bricks on maps instead of circles
In his recent newsletter, Stephen Few introduces the concept of using bricks as "A New, More Perceptible Method for Encoding Quantitative Values in Geospatial Displays".
Now, I am not a fan of geospatial data visualizations at the best of times and have blogged and tweeted about that in the past (for example, see Do we really need maps for analysis?) I particularly don't like the ideal of using bubble size to encode value on a map so the idea the bricks might be a better idea was intriguing.
Stephen uses a map of the US and juxtaposes the use of bricks with another map using circles to contrast. It is quickly obvious that the bricks are much easier to compare, say, Washington State with Florida. With the circles it is difficult to perceive the difference. With the bricks, one can see the difference easily.
Inspired by Stephen, and challenged by Brian Dunphy on Twitter, I decided to have a go at doing this in QlikView. It was a fair challenge and helped me build up some skills with using the jQuery library (which is embedded with QlikView in version 11+ so you don't need to load it separately). Here is the result (using the old QlikView Google Maps demo document of London properties):
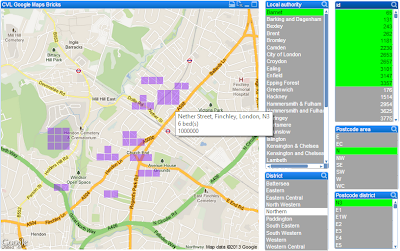
Not bad! But I quickly noticed a problem with this application, which Stephen mentions in his article. When circles overlap, they are still legible. When the bricks overlap, they become completely unreadable!

So, it can work quite well where the data points are spread apart, but not great where there is overlap. I think that if you are doing something for states / provinces / countries, where the data points are more distinct and can be controlled, then this can be useful. But I might still choose a bar chart!
Stephen Redmond is CTO of CapricornVentis a QlikView Elite Partner. We are always looking for the right people to join our team.
Follow me on Twitter: @stephencredmond
Subscribe to:
Posts (Atom)