If reducing the memory requirement of your QlikView document is important, this tip might help shave a few bytes that could add up to a significant performance gain.
There are several documents on performance improvement that will suggest that you should shed fields that do not contain data that will be used. My tip is to look at fields that has data that you do use and shed the data in those that you won't!
One example would be a numeric field that may contain a lot of zeros. If the only use of this field is in a sum, then there is no different in that zero being there or not. The only difference would be in a count or avg. Therefore, if you have a lot of zeros in a field that will only be summed, consider transforming them to null() in your load.
...
if(Field1=0,Null(),Field1) as Field1,
...
If you need to use that field in a horizontal calculation, you can use the Alt function:
Alt(Field1, 0) + Alt(Field2, 0)
Another type field that we are often told to look at getting rid of is key fields. They are often highly unique so will take up the most space in the dataset. It is often straightforward to remove them, but what if they are needed? Perhaps as a key link in a 1:M relationship.
For example, say you had an Account table with a key field called AccountID. There is also an AccountHistory table which associates on AccountID. You can't readily join the two tables so you need to keep the key field. However, if there is not an entry for every Account in the AccountHistory table, you don't need to keep the value for that particular AccountID in the field! Null it!
I might create a mapping table:
KeyMap:
Mapping Load Distinct
AccountID, AccountID
Resident AccountHistory;
Then, in my Account table load:
...
ApplyMap('KeyMap', AccountID, Null()) As AccountID,
...
Now, this is not going to be significant over a million records. However, over a hundred million, you will see a difference.
Stephen Redmond is CTO of CapricornVentis a
QlikView Elite Partner
Tuesday 6 December 2011
Sunday 4 December 2011
The Right Background
I have talked about color choice recently, but whatever choice you make for the colors you are going to use, the choice of background color is critical.
You may have seen an image like this before:

If you haven't, the question is - which of the 5 squares inside the colored box is the same color as the square outside the box. The answer is that all of the 5 squares are the same color. The only difference is the background.
The rule, therefore, is that when choosing a background, it must be a single color. You can't use any type of "gradient" effect or, even worse, use an image as your background.
So, what is the best color to use for the background?
In the world of software development, most IDEs (Integrated Developments Environments), such as Microsoft Visual Studio, have a default of a white background for the code and darker contrasting text. There have been many debates on the use of white as a background. The main one being that the white is wearing on the eye.
Some prefer black or dark blue with lighter contrasting text. However, there is a visual effect that works against this - well known by photography experts - called Halation. This is the effect of brighter colors seeming to spread when on darker backgrounds and hence look a little blurred. This can cause eye strain.
Some suggest that softer grey backgrounds. However, the issue here is that the softer contrast can have an effect on interpretation of color coding in scripting, and it is difficult to find a right choice of usable colors to offset this. This is a feature that increases productivity in developers, so any reduction in its efficacy is not a welcome.
So, it appears that white might just be the right background color for developers, but this post is not about the best color to use for developing - it is for use in the display of quantitative data.
In an article called "Choosing Colors for Data Visualization", Maureen Stone, of StoneSoup Consulting and formerly of the Xerox Palo Alto Research Center, tells us that most color palettes are designed to be printed on white paper so using a white background is the right choice in digital form. If your presentation is going to end up on paper, then designing on a white background is the right choice.
Further, Maureen tells us that there are perceptual advantages in using white as the human visual system is designed to adapt its color perception relative to the local definition of white and giving a white background gives us a stable definition of "white".
As a last word on this subject, I looked at six of the worlds most popular websites:

All use a lighter background and darker foreground (not necessarily black, blue/purple are popular) and, with the exception of YouTube (which has only changed recently), that color is white. These companies have the resources to spend a lot of money on choosing the right background colors.
Who am I to disagree with them.
Stephen Redmond is CTO of CapricornVentis a QlikView Elite Partner
Friday 2 December 2011
Easy Ad-Hoc Analysis in QlikView
I was demonstrating server object collaboration recently (the ability for end-user to create different charts and other objects and then share these with other users) to a group of users. For me, it is quite straightforward to create a new chart but as their eyes glazed over, I thought to myself, "there must be an easier way."
So I created a view something similar to this one:

What I have here is 2 charts and a few list boxes (main filter list-boxes in a container). The top two list boxes are for "Measure" and "Sort Order". These are "Data Island" values loaded like this:
Set HidePrefix='%';
Expressions:
Load
%MeasureID,
%Measure,
Replace(%MeasureExpression, '##', '$') As %MeasureExpression
Inline [
%MeasureID, %Measure, %MeasureExpression
1, Total Sales, Sum(LineSalesAmount)
2, Cost of Sales, Sum(COGS)
3, Sales Margin, Sum(Margin)
4, Sales Current Year, Sum({} LineSalesAmount)
5, Sales Last Year, Sum({} LineSalesAmount)
];
ExpressionSort:
Load * Inline [
%SortOrder
Y-Value
Default
];
Now, the expressions table here would probably not be inline. It is more likely to be in an Excel document or in a database and then added to based on user demand. You will note that I have to use "##" and then replace with the "$" as it doesn't work with the "$" in situ (QlikView thinks it is a dollar-expansion). You wouldn't have this problem if the source was an external one.
So, this table is a list of the most common expressions that would be used in this particular document. It could be 2, it could be 100. There is no limit here.
A couple of things to note. I have prefixed with "%" and set the HidePrefix value. This is important because your Expression selection does not then appear in Current Selections - which wouldn't make sense to the user.
The second thing to note is that you need to include the MeasureID field because we will use that later to sort the measures.
My bar chart (although it has a fast-change to line) has a Cyclic group as its dimension so I can choose any of my main dimensions. It has two expressions:
1: $(=FirstSortedValue(%MeasureExpression, %MeasureID))
and
2: if(Count(DISTINCT %Measure)=2,
$(=FirstSortedValue(%MeasureExpression, -%MeasureID)),
Null())
This structure allows me to pick up to 2 expressions (I check for this in the calculation condition of the chart). If only one is selected then the 2nd expression is Null() (I have an equivalent formula for the expression label) and QlikView treats it as if it isn't there - which is what I want.
For the sort order, I override the default group order and set as a descending expression:
if(%SortOrder='Y-Value', $(=FirstSortedValue(%MeasureExpression, %MeasureID)), Null())
If all the other sort options (e.g. Text Value) are not checked, the null in this expression will default to the default sort order of the dimension anyway.
The pivot table (which fast-changes to a straight table) is similarly constructed except I use 3 cyclic groups as the dimensions. This gives the users a lot of options.
Worth having a play with it and seeing what you can come up with.
BTW - this will, of course, work with Small Business edition of QlikView which does not support server objects. Also, users selections can be stored as bookmarks.
Stephen Redmond is CTO of CapricornVentis a QlikView Elite Partner
So I created a view something similar to this one:

What I have here is 2 charts and a few list boxes (main filter list-boxes in a container). The top two list boxes are for "Measure" and "Sort Order". These are "Data Island" values loaded like this:
Set HidePrefix='%';
Expressions:
Load
%MeasureID,
%Measure,
Replace(%MeasureExpression, '##', '$') As %MeasureExpression
Inline [
%MeasureID, %Measure, %MeasureExpression
1, Total Sales, Sum(LineSalesAmount)
2, Cost of Sales, Sum(COGS)
3, Sales Margin, Sum(Margin)
4, Sales Current Year, Sum({
5, Sales Last Year, Sum({
];
ExpressionSort:
Load * Inline [
%SortOrder
Y-Value
Default
];
Now, the expressions table here would probably not be inline. It is more likely to be in an Excel document or in a database and then added to based on user demand. You will note that I have to use "##" and then replace with the "$" as it doesn't work with the "$" in situ (QlikView thinks it is a dollar-expansion). You wouldn't have this problem if the source was an external one.
So, this table is a list of the most common expressions that would be used in this particular document. It could be 2, it could be 100. There is no limit here.
A couple of things to note. I have prefixed with "%" and set the HidePrefix value. This is important because your Expression selection does not then appear in Current Selections - which wouldn't make sense to the user.
The second thing to note is that you need to include the MeasureID field because we will use that later to sort the measures.
My bar chart (although it has a fast-change to line) has a Cyclic group as its dimension so I can choose any of my main dimensions. It has two expressions:
1: $(=FirstSortedValue(%MeasureExpression, %MeasureID))
and
2: if(Count(DISTINCT %Measure)=2,
$(=FirstSortedValue(%MeasureExpression, -%MeasureID)),
Null())
This structure allows me to pick up to 2 expressions (I check for this in the calculation condition of the chart). If only one is selected then the 2nd expression is Null() (I have an equivalent formula for the expression label) and QlikView treats it as if it isn't there - which is what I want.
For the sort order, I override the default group order and set as a descending expression:
if(%SortOrder='Y-Value', $(=FirstSortedValue(%MeasureExpression, %MeasureID)), Null())
If all the other sort options (e.g. Text Value) are not checked, the null in this expression will default to the default sort order of the dimension anyway.
The pivot table (which fast-changes to a straight table) is similarly constructed except I use 3 cyclic groups as the dimensions. This gives the users a lot of options.
Worth having a play with it and seeing what you can come up with.
BTW - this will, of course, work with Small Business edition of QlikView which does not support server objects. Also, users selections can be stored as bookmarks.
Stephen Redmond is CTO of CapricornVentis a QlikView Elite Partner
Saturday 26 November 2011
Delivering BI to Customers
It was great to see a project that I have been involved with being mentioned in the press:
Electricity company pushes out BI tool to customers
It would have been nice to see CapricornVentis being mentioned in the article.
We now have several clients who deliver BI to clients using QlikView. These clients range from:
Utilities - delivering usage information to end users to encourage behavior change, saving energy.
Banking - delivering information to their customers to allow better decision making.
Global Farm Feed Company - allowing farmers in 25 countries to measure feed efficiency.
While none of these implementations is trivial, it is great to work with a great technology like QlikView as the enabler. And looking forward to delivering many more - especially on version 11.
If you need to deliver BI to your customers, feel free to give CapricornVentis a call.
Stephen Redmond is CTO of CapricornVentis a QlikView Elite Partner
Sunday 6 November 2011
Denormalize for Performance
It was gratifying for me to find out, after many QlikView implementations, that most of what I was doing was close to best practice in Dimensional Modelling. I thought that I was mostly just building key tables to fix data connection issues and the denormalizing to clean the data structure and improve performance.
If you are unfamiliar with Dimensional Modelling, it has been around for a very long time - as long as QlikView! Ralph Kimball, one of the early data warehouse pioneers, has literally written the book on the subject and has many great articles on his website:
http://www.kimballgroup.com/html/articles.html
If you are not familiar with relational database theory, the idea of normalization is to remove redundancy. For example, if I have a simple product table like this:
The category name of "Bings" is repeated several times. In a relational database this value is actually stored several times. From a storage point of view, it is more efficient to split the product table into a product and a category table like this:
In this case, the numeric ID "1" is stored several times but that takes up a lot less space than the word "Bings" which is now only stored once. It also means that if I need to change the name of that category, I only need to change it in one location, thus improving my data consistency.
This system has been implemented widely. Some architectures that you might come across, such as SAP or Oracle Financials, have thousands of tables, all perfectly crafted to store the data most efficiently in the relational database. Normalization works great for transactional databases like this.
For designers, the problem occurred when people started reading data out of the transactional system, especially for reporting. Because the queries now had to hop across several joins, the performance suffers immensely. So, they started either undoing the normalisation process (denormalising) or, worse, keeping the normalised tables but duplicating the data into other tables so that queries ran quicker - a nightmare for data consistency. Both approaches lead to an increase in the data storage requirements meaning that databases bloat more an more - but we can just throw hardware at that issue, right?
So, what is the best thing to do in QlikView? A colleague of mine who was recently trained asked me about this because of the exercise that was to move the category table's data into the product table, hence denormalizing. "Why?", he asked. "Doesn't QlikView work just as well either way?".
There are a couple of reasons as to why you might do this. And a couple of reasons why you might not.
Reasons for:
In one of his articles, Kimball suggests that such "snow-flaking" (leaving the category out of the product table) "compromises cross-attribute browsing performance". Not only that, it "may interfere with the legibility of the database".
So that gives us 2 reasons:
- Performance
- Improved schema readability
And I will add a 3rd:
- Data size.
In the QlikView underlying data cloud, there will be an association between the product fields and the CategoryID field. There will also be an association between the CategoryID field and the CategoryName field. If I move the CategoryName into the product table (either map or join), I can then remove the CategoryID field and hence remove a redundant set of associations. The CategoryName is not duplicated in QlikView because the columnar database still only stores it once.
Reasons against:
- Performance
- Improved schema readability
- Data size
I'm sure that you will be thinking that there is some sort of error here. How can I have the same set of reasons "against" as I did "for"?
It depends! It depends really on the number of records in each table and the number of fields. For a relationship like product and category, there is probably only a few fields in the category table and it can really make sense to denormalise (it almost always make sense to do this for a table with only 2 fields - using ApplyMap). However, with a couple of tables like, say, Order and Calendar, where Order may have millions of records and Calendar could have ten or more fields, it makes sense to keep them apart and just have the key association on the DateID field. If you did join them in, it would mean that you could drop the DateID field but you would then have associations maintained between each field in the Order table and Year, and Month, and Day, and Week, etc., etc. Many more associations being maintained than before and increasing your data size and possibly reducing your performance. It may also become difficult to see the date fields in the schema whereas they are plain to see in their own Calendar table.
Stephen Redmond is CTO of CapricornVentis a QlikView Elite Partner
If you are unfamiliar with Dimensional Modelling, it has been around for a very long time - as long as QlikView! Ralph Kimball, one of the early data warehouse pioneers, has literally written the book on the subject and has many great articles on his website:
http://www.kimballgroup.com/html/articles.html
If you are not familiar with relational database theory, the idea of normalization is to remove redundancy. For example, if I have a simple product table like this:
| Product Table | ||
|---|---|---|
| ProductID | ProductName | Category |
| 1 | BingBong | Bings |
| 2 | BingBang | Bings |
| 3 | BingBung | Bings |
The category name of "Bings" is repeated several times. In a relational database this value is actually stored several times. From a storage point of view, it is more efficient to split the product table into a product and a category table like this:
| Product Table | ||
|---|---|---|
| ProductID | ProductName | CategoryID |
| 1 | BingBong | 1 |
| 2 | BingBang | 1 |
| 3 | BingBung | 1 |
| Category Table | |
|---|---|
| CategoryID | Category |
| 1 | Bings |
In this case, the numeric ID "1" is stored several times but that takes up a lot less space than the word "Bings" which is now only stored once. It also means that if I need to change the name of that category, I only need to change it in one location, thus improving my data consistency.
This system has been implemented widely. Some architectures that you might come across, such as SAP or Oracle Financials, have thousands of tables, all perfectly crafted to store the data most efficiently in the relational database. Normalization works great for transactional databases like this.
For designers, the problem occurred when people started reading data out of the transactional system, especially for reporting. Because the queries now had to hop across several joins, the performance suffers immensely. So, they started either undoing the normalisation process (denormalising) or, worse, keeping the normalised tables but duplicating the data into other tables so that queries ran quicker - a nightmare for data consistency. Both approaches lead to an increase in the data storage requirements meaning that databases bloat more an more - but we can just throw hardware at that issue, right?
So, what is the best thing to do in QlikView? A colleague of mine who was recently trained asked me about this because of the exercise that was to move the category table's data into the product table, hence denormalizing. "Why?", he asked. "Doesn't QlikView work just as well either way?".
There are a couple of reasons as to why you might do this. And a couple of reasons why you might not.
Reasons for:
In one of his articles, Kimball suggests that such "snow-flaking" (leaving the category out of the product table) "compromises cross-attribute browsing performance". Not only that, it "may interfere with the legibility of the database".
- Performance
- Improved schema readability
And I will add a 3rd:
- Data size.
In the QlikView underlying data cloud, there will be an association between the product fields and the CategoryID field. There will also be an association between the CategoryID field and the CategoryName field. If I move the CategoryName into the product table (either map or join), I can then remove the CategoryID field and hence remove a redundant set of associations. The CategoryName is not duplicated in QlikView because the columnar database still only stores it once.
Reasons against:
- Performance
- Improved schema readability
- Data size
I'm sure that you will be thinking that there is some sort of error here. How can I have the same set of reasons "against" as I did "for"?
It depends! It depends really on the number of records in each table and the number of fields. For a relationship like product and category, there is probably only a few fields in the category table and it can really make sense to denormalise (it almost always make sense to do this for a table with only 2 fields - using ApplyMap). However, with a couple of tables like, say, Order and Calendar, where Order may have millions of records and Calendar could have ten or more fields, it makes sense to keep them apart and just have the key association on the DateID field. If you did join them in, it would mean that you could drop the DateID field but you would then have associations maintained between each field in the Order table and Year, and Month, and Day, and Week, etc., etc. Many more associations being maintained than before and increasing your data size and possibly reducing your performance. It may also become difficult to see the date fields in the schema whereas they are plain to see in their own Calendar table.
Stephen Redmond is CTO of CapricornVentis a QlikView Elite Partner
Friday 28 October 2011
Color coding RAGs
I have been thinking a lot about color and its use in data presentation recently. Color use is something that is especially of interest to me as I find myself to be one of the 8-10% of the male population who suffers from color blindness. In my case, I have the most common difficulty which is red-green. Essentially what happens is that different shades of red and green become more brown to me and therefore two distinct colors, that have a similar saturation and brightness, may actually appear to be the same to me.
One area where this is particularly significant is with RAGs - Red, Amber, Green indicators which will usually indicate Bad, not so bad, and good respectively.

In this example, I have shown pure red, amber and pure green. For me, while they are relatively easy to spot here, the green and amber colors can look very similar on smaller displays or where they are not right together (like in a traffic-light or beacons on a page).
I always like to use Stephen Few as a reference and he has discussed this in his books as well as this useful article: Practical Rules for Using Colors in Charts.
If we think about it, the situations of good, not so good, and bad are actually a sequence so would fall under Stephen's rule 6:
When using color to encode a sequential range of quantitative values, stick with a single hue (or a small set of closely related hues) and vary intensity from pale colors for low values to increasingly darker and brighter
colors for high values.
So, why should we have to use red, amber and green? Perhaps another solution would be just to use shades of red:

Here we have an almost white color representing good (and white would be a good option too as most people are not looking for good, just for the bad). The range gets darker along with the situation.
Of course, one of the problems that might be raised with you is that people "intuitively" understand RAG and that one needs to conform to the "norm".
This thinking was fresh in my mind while recently passing through a UK airport. They have the normal type of gate signs which they have color coded for 4 statii which are to advise passengers on the status of boarding their flight: nothing happening, go to gate, plane is boarding, gate is closing.

The "nothing" status is represented by no color - it matches the black background and that is probably a good choice. The "closing" status is dark red and this is also a good choice because that indicates (in "western" society anyway) danger and the need to get a move on. However, the "go to gate" is coded in amber and the "boarding" is green. This doesn't appear very logical to me as, if I was some way from the gate, "boarding" would be something much more urgent than "go to gate". I am sure that there is a logical explanation, but this doesn't come across to me.
Here, I think, would be a good idea to use something like white background for "go to gate" and something like amber or yellow for "boarding" - they are logically closer to the red of "closing" and should indicate to the passenger that they should get to the gate asap.
Stephen Redmond is CTO of CapricornVentis a QlikView Elite Partner
Thursday 15 September 2011
Setting default display format
Following on from the last post on Setting default sort order, there are other things that we can load up in advance that can be of assistance.
For example, I have a date field called OrderDate which is coming in with a default format of DD/MM/YYYY hh:mm:ss but the time portion has no use to me because it is just 00:00:00 for all the dates.
Now, I could load this using a simple:
...
Date(OrderDate, 'DD/MM/YYYY') As OrderDate,
...
This is what I would normally do. However, what if the data is coming from a very large QVD and I would like to keep the optimized load. Applying a format function like this will prevent the load being optimized. So, I should do the format in the script that creates the QVD - but what if I am not controlling that?
Simple - just as with the load order, the default format of a field is set when you first load it. We can create a simple load like this:
FormatTable:
Load
Num(0, '#,##0.00') as LineSalesAmount,
Date(Today(), 'DD/MM/YYYY') As OrderDate
AutoGenerate(1);
Now, I go ahead and load my Order table (note that I have included a format for the sales value too - you can have as many as you need).
Sometime after I have loaded the Order table, I need to drop the Format Table:
Drop Table FormatTable;
I hope this saves you a bit of time.
Stephen Redmond is CTO of CapricornVentis a QlikView Elite Partner
Setting default sort order
Sometimes we load some categorical data (e.g. Country) that we want to display in a specific order other than the default (alphabetical for example). Here's an example that you might have come across:
High, Medium, Low
An interesting thing about QlikView is that it remembers how things are first loaded. We can use this little trick to load a temporary table with just the field that we want in the order that we want. Then, even if we drop this table later, QlikView remembers that order and we can use the "Load Order" sort option.
Here is an example. If I had a sales table like this:
Sales:
CrossTable(Year, Sales)
Load * Inline [
Country, 2009, 2010, 2011
Ireland, 200, 300, 400
Scotland, 100, 150, 300
Wales, 500, 300, 400
England, 800, 700, 800
];
But, rather than the alpha-sort of England, Ireland, Scotland, Wales, I would like to have Wales, Ireland, England, Scotland, then I can load a table just before the Sales table like this:
SortOrder:
Load * Inline [
Country
Wales
Ireland
England
Scotland
];
Then, sometime after I have loaded the Sales table, I can drop the SortOrder table:
Drop Table SortOrder;
Now, I can use the "Load Order" sort:

Stephen Redmond is CTO of CapricornVentis a QlikView Elite Partner
Monday 15 August 2011
Irish crime stats. Sleeping easy in my bed?
I was interested to see the recent announcement of the quarterly Irish crime statistics for Q2 of 2011 by the Central Statistics Office. The press surrounding this latest information hailed the quarter-on-quarter reduction in crime across all categories (for example, from the Irish Examiner).
So, I thought that I would grab the CSO figures and run them into QlikView. You can download the resulting document from QlikCommunity.

It does indeed appear that the crime figures are down across all categories. Of course, one swallow does not make a summer and neither does a change between one period and another indicate a trend. This is where a control charts come in most usefully - is there a downward trend?

Looking at the national figures in a control chart, it does look like there is a steady downward trend. The latest figures have dropped below the control limits (my limits are based on the 2006-2008 data). There is a certain seasonality about the crime figures so I have added a 4 period mean here. Even that appears to be dropping. Looks like the police are doing a great job.
I thought that I might have a delve around in the figures and thought about which if the different crime categories would be more of a concern to me. For example, I am not terribly worried about public order offences, but I am a little more worried about my car being broken into. I don't worry about homicide (Ireland has one of the lowest rates in the world) but I do have concerns about being assaulted. There are some crimes that are more "personal" than others.

If I break down the categories into the ones that I am more concerned about (assaults, burglary, robbery, theft, sexual assault), I see that these represent 45% of the total figures for the whole data set. Interestingly, this is now 48.6% for just 2011!

When I look at these categories in the control chart, I see that these are not decreasing. They are steadily above the mean line for the last 16 quarters. While some have associated increases with the recessionary times, it appears that the increase started in 2007 - a year before Lehman Brothers collapsed.
So, while the Gardaí (Irish police) are doing a good job in reducing crime in some areas, there are some that perhaps need more attention.
Stephen Redmond is CTO of CapricornVentis a QlikView Elite Partner
Friday 29 July 2011
Out of Control? Dublin Climate Data
Last year, I attended Performance Measure Blueprint training with Stacey Barr. One of Stacey's recommended visualizations was the statistical control chart. Stacey also recommended "Understanding Variation: The Key to Managing Chaos" by Donald J. Wheeler in this regard.
Essentially, the control chart introduces some solid statistical thinking into the analysis of data. Quite often, people might have a bipolar view of variation in data - things are up on last month, everything is good, things are down on last month, everything is bad and we need to start changing the process to make sure that things are up next month! The control chart allows us to see that these up/down variations are part of a statistically expected change and, unless they are outside of the control lines or, repeatedly above or below the mean.
An after-dinner discussion recently, on the probability of having a good/bad summer or a cold/mild winter, led me to think of applying control charts to climate data for Dublin.
I was able to obtain historical data from European Climate Assessment & Dataset and more recent data from MET Éireann (the Irish meteorological service).
The QlikView document that I created is available to download from QlikCommunity and will shortly be available to view on share.qlikview.com.
Some interesting analysis!

There is a perception amongst Irish people (especially after a very unusual period of snow last December) that winters are getting much colder and hence we are likely to have a cold winter again this year.
Looking at the data since 1881 (control is based on average between 1961 and 1990 - this is the comparison period used by MET Éireann), it appears that the Dublin climate has been up and down through the 150 years but has always been within the Control - except for 2010. The average temperature for 2010 made a huge dive south and is now out of control. It would appear that yes, the winters are getting colder and we should all invest in snow chains and shovels that we never needed before.

Looking at the data by month, it appears to be even more apparent. The last couple of winters both have troughs outside the control. I do need a new woolen coat - I might get it cheaper if I buy it now.

An interesting thing about the two troughs in the monthly chart though, they are both representing months that are in one year period - 2010. 2010 had 2 of the coldest months for a long time (December was the coldest on record) so that would be why the year as a whole was so far south of the control line. But those 2 months were not concurrent - they were at either end of the year. Maybe I don't need to get that coat yet?
Perhaps, if I want to look at "winter", I should look at the data in seasons instead. So, in my QlikView document, I created a dimension called Season and one called YearSeason - breaking the data into "traditional" seasons of winter = Nov-Jan, spring = Feb-Apr, etc.

Hmm. This data is every winter from 1960 to 2010 (which includes January 2011). This is quite interesting because it shows that, despite having the coldest December on record, the winter of 2010 was still inside the control. In fact, other cold winters such as 1962 and 1976 also are within the control.
So, how cold will the winter of 2011 be? I can't say for sure but, I do have a good level of statistical confidence that it will be less severe than 2010. The system is still in control and the historical evidence is that it will stay in control.
Maybe I don't need those snow chains - not just yet anyway.
Stephen Redmond is CTO of CapricornVentis a QlikView Elite Partner
Tuesday 12 July 2011
Is it time to replace the Quick Chart Wizard?
I have been contemplating the Quick Chart Wizard in QlikView recently.
Creating charts in QlikView is very easy once you have a reasonably good grasp of the properties and where everything is. However, for "business" users, this is not always simple. Enter the Quick Chart Wizard. My experience, however, is that the output of the Quick Chart Wizard is almost never an immediately usable chart - you almost always have to then go into the properties to clean it up.
There are, I believe, only a couple of options that need to be set in the Wizard to make it produce immediately usable charts almost all the time. And while we are at it, why not do away with a "Wizard" at all and just have everything visible on one page with a preview of what you are building.
Here is my proposed solution:

What do you think?
Design reasoning:
Dimensions - only 2 (instead of 3 in current Wizard). Vast majority of charts will have 1 dimension. 3 is a rarer requirement so remove from Quick Wizard.
Expression - Only one option (as per current Wizard). Added option to label the expression.
Chart options - reduced to 4 of the most common used (removed Pie and Guage from existing Wizard). Give options on Orientation and Mode (which grey out if not relevant)
Titles - not available in current Wizard but something that users will almost always want to change.
Sort by: I never create a Bar chart that I don't specify a sort order on, so this should be available as an option.
Dimension Limitations: With bar charts, this is something that I probably do more often than not.
Preview Window: Show the user exactly what they are building as they are building it.
I am really interested in all opinions on this. Does anyone think that the existing Wizard has value?
Join the discussion on QlikCommunity.
Stephen Redmond is CTO of CapricornVentis a QlikView Elite Partner
Alternative to Grid-Style Multi-Boxes in Ajax
I quite like the "grid style" format for multi-boxes. In a limited width, I think that it is a better format for the drop-downs because you get the full width of the control rather than the truncated width of just the drop-down part in the standard view.

A problem for me is that "grid style" does not render at all in Ajax (I can't understand why!)
I picked up an interesting tip yesterday from QlikView's Kenneth Lewis. How about using a Container control with multiple list boxes? I thought about it and then tried it out. I think that it works quite nicely. By adding several list boxes and then setting the Appearance property of the Container to "dropdown at top", I get a result that works in both QV and Ajax.

It is not a perfect replacement for the grid-style multibox but, in some ways, it is better. I like the fact that you have the list box icons available and it is easier to see the Green/White/Grey.
Have a play with it and see what you think.
Stephen Redmond is CTO of CapricornVentis a QlikView Elite Partner
Thursday 30 June 2011
Nobody said it was easy ... Configuring LDAP
Recently I was in discussions with a client where they wanted to authenticate users against a Netscape LDAP server. Of course, I told them that this would be no problem because QlikView 10 now comes with a Configurable LDAP directory service connector. Easy peasy!
The client was satisfied and look like they will go ahead and order the new licenses (yay!) and hardware to implement it on.
Gulp! I still hadn't played with this LDAP connector so I though I better get some handle on it before the implementation went ahead. Of course, there is bountiful documentation on it in the server reference manual (well, just under 2 pages). Luckily I had recently met the genius that is Michael Robertshaw, a Solutions Consultant for QlikView in the Netherlands. With some guidance from him, I was able to get up and running.
I found a distribution of OpenLDAP for Windows and installed it on my PC. Once I had an idea of what I was doing, it was actually quite straightforward (Note - choose BDB database, not LDAP during setup and all will be well!) Once I was up and running, I used a tool called LDAP Admin to add new users and groups.
Now to the QlikView side of things. I had thought that this should be quite straightforward. It wasn't initially, but with the help of Michael I got there in the end. The important thing to know is that LDAP and Active Directory LDAP are not necessarily the same thing. There are a lot of differences. Unfortunately, the defaults for the DSP entries are AD ones so these needed to change. Also, the way that the server is specified is not as easy as I thought it should be, but easy to get right once you know.
I had thought that the correct Path entry for my server should have been:
LDAP://myserver
This is what you will see for AD. However, I also found that you need to specify the base search path in this string for me, with my settings of "mydomain.com", this was:
LDAP://myserver/dc=mydomain,dc=com
Once I added this and the correct username and password (note that the username needs to be the fully qualified name, e.g. cn=Manager,dc=mydomain,dc=com), I was able to think about the DSP settings. These are accessed via the pencil icon beside the password box. Now, this is where the Active Directory defaults will need to be changed. The defaults are:
Account Name : sAMAccountName
Directory Label : DSP1 *
Display Name : name
Distinguished Name : distinguishedName
Group member :
Group object class : group
Id Property name : sAMAccountName
LDAP Filter : (&(!(objectclass=computer))(objectGUID=*))
User member of : memberOf
User object class : user
* the directory label is how you will identify users to QlikView, e.g. in this case - DSP1\username.
With advice from Michael and some testing, I found the best settings for OpenLDAP (other LDAPs may be different - use the LDIF information to help you work it out) to be:
** memberOf (used to check users are in a group) will only work in OpenLDAP if the memberOf overlay is enabled and working.
With these settings, I am now able to use the UserManagement in Enterprise Management Console to query the LDAP directory.
I tested that it was working by creating a new document on my server and used DMS to give access to a user called MyDomain\jdoe (who was a valid user in my LDAP). I then generated a ticket for the user and connected successfully to the document.
Stephen Redmond is CTO of CapricornVentis a QlikView Elite Partner
The client was satisfied and look like they will go ahead and order the new licenses (yay!) and hardware to implement it on.
Gulp! I still hadn't played with this LDAP connector so I though I better get some handle on it before the implementation went ahead. Of course, there is bountiful documentation on it in the server reference manual (well, just under 2 pages). Luckily I had recently met the genius that is Michael Robertshaw, a Solutions Consultant for QlikView in the Netherlands. With some guidance from him, I was able to get up and running.
I found a distribution of OpenLDAP for Windows and installed it on my PC. Once I had an idea of what I was doing, it was actually quite straightforward (Note - choose BDB database, not LDAP during setup and all will be well!) Once I was up and running, I used a tool called LDAP Admin to add new users and groups.
Now to the QlikView side of things. I had thought that this should be quite straightforward. It wasn't initially, but with the help of Michael I got there in the end. The important thing to know is that LDAP and Active Directory LDAP are not necessarily the same thing. There are a lot of differences. Unfortunately, the defaults for the DSP entries are AD ones so these needed to change. Also, the way that the server is specified is not as easy as I thought it should be, but easy to get right once you know.
I had thought that the correct Path entry for my server should have been:
LDAP://myserver
This is what you will see for AD. However, I also found that you need to specify the base search path in this string for me, with my settings of "mydomain.com", this was:
LDAP://myserver/dc=mydomain,dc=com
Once I added this and the correct username and password (note that the username needs to be the fully qualified name, e.g. cn=Manager,dc=mydomain,dc=com), I was able to think about the DSP settings. These are accessed via the pencil icon beside the password box. Now, this is where the Active Directory defaults will need to be changed. The defaults are:
Account Name : sAMAccountName
Directory Label : DSP1 *
Display Name : name
Distinguished Name : distinguishedName
Group member :
Group object class : group
Id Property name : sAMAccountName
LDAP Filter : (&(!(objectclass=computer))(objectGUID=*))
User member of : memberOf
User object class : user
* the directory label is how you will identify users to QlikView, e.g. in this case - DSP1\username.
With advice from Michael and some testing, I found the best settings for OpenLDAP (other LDAPs may be different - use the LDIF information to help you work it out) to be:
Account Name : cn
Directory Label : MyDomain
Display Name : displayName
Distinguished Name : dn
Group member : memberUid
Group object class : posixGroup
Id Property name : cn
LDAP Filter : (yes, this is blank!)
User member of : memberOf **
User object class : posixAccount
** memberOf (used to check users are in a group) will only work in OpenLDAP if the memberOf overlay is enabled and working.
With these settings, I am now able to use the UserManagement in Enterprise Management Console to query the LDAP directory.
I tested that it was working by creating a new document on my server and used DMS to give access to a user called MyDomain\jdoe (who was a valid user in my LDAP). I then generated a ticket for the user and connected successfully to the document.
Stephen Redmond is CTO of CapricornVentis a QlikView Elite Partner
Tuesday 14 June 2011
AND Mode in Set Analysis
Was on QlikCommunity recently and answered a query by Lawrence Chapman - Like for Like
When Lawrence replied, he said that he was looking for something quite reasonable in his chart - only sites that had records for all the 4 years.
I was thinking that this should be quite straightforward and then had to have another think! The thing about QlikView set analysis is that it is just a set of selections. The default selection mode in a field in QlikView is "OR". So, if I select all the 4 years, I will still select all the sites because all of them are in at least one year. Creating a set based in the year field wouldn't work for what Lawrence wanted.
I thought about how I would select those sites if I was just doing it in the layout (which is a great strategy for designing a set). The only way that I can think of doing it is to have a selection box using QlikView's AND-mode.
Now, for AND-mode to be enabled, there are a certain number of criteria that need to be fulfilled. Basically, the field needs to be in a table of only 2 fields and it is the 2nd field (the first is the key field associating the rest of the data set). Also, the table needs to be loaded with the DISTINCT keyword to remove duplicates (have a look in the help file for more info).
Let me create a quick example to show this in action. Here is a sales table:
Sales:
LOAD * INLINE [
Customer, Year, Sales
Customer A, 2009, 111
Customer B, 2009, 111
Customer C, 2009, 111
Customer A, 2010, 222
Customer B, 2010, 222
Customer C, 2010, 222
Customer A, 2011, 333
Customer C, 2011, 333
];
You will note that only Customer A and Customer C exist in all years. However, if I load this data, there is no set that I can create that shows me just the totals for those 2 customers based only on the fact that they have sales in each of the years.
So, I will create an AND-mode field:
SalesYear:
Load Distinct
Customer,
Year As SalesYear
Resident Sales;
Once loaded, I add this field to the layout and select the "AND-mode" option in the List Box properties (this option will be grayed out unless the field fulfills the criteria above).
N.B. At this stage, just after setting "AND-mode" in the list box, you may need to just run a re-load to set the internal flag that makes everything else below work.
Now, I can create a set expression like this:
Sum({<SalesYear={2009,2010,2011}>} Sales)
And it will only show me the sales for Customer A and C.
I could make this more generic by limiting the SalesYear to the currently selected Years:
Stephen Redmond is CTO of CapricornVentis a QlikView Elite Partner
When Lawrence replied, he said that he was looking for something quite reasonable in his chart - only sites that had records for all the 4 years.
I was thinking that this should be quite straightforward and then had to have another think! The thing about QlikView set analysis is that it is just a set of selections. The default selection mode in a field in QlikView is "OR". So, if I select all the 4 years, I will still select all the sites because all of them are in at least one year. Creating a set based in the year field wouldn't work for what Lawrence wanted.
I thought about how I would select those sites if I was just doing it in the layout (which is a great strategy for designing a set). The only way that I can think of doing it is to have a selection box using QlikView's AND-mode.
Now, for AND-mode to be enabled, there are a certain number of criteria that need to be fulfilled. Basically, the field needs to be in a table of only 2 fields and it is the 2nd field (the first is the key field associating the rest of the data set). Also, the table needs to be loaded with the DISTINCT keyword to remove duplicates (have a look in the help file for more info).
Let me create a quick example to show this in action. Here is a sales table:
Sales:
LOAD * INLINE [
Customer, Year, Sales
Customer A, 2009, 111
Customer B, 2009, 111
Customer C, 2009, 111
Customer A, 2010, 222
Customer B, 2010, 222
Customer C, 2010, 222
Customer A, 2011, 333
Customer C, 2011, 333
];
You will note that only Customer A and Customer C exist in all years. However, if I load this data, there is no set that I can create that shows me just the totals for those 2 customers based only on the fact that they have sales in each of the years.
So, I will create an AND-mode field:
SalesYear:
Load Distinct
Customer,
Year As SalesYear
Resident Sales;
Once loaded, I add this field to the layout and select the "AND-mode" option in the List Box properties (this option will be grayed out unless the field fulfills the criteria above).
N.B. At this stage, just after setting "AND-mode" in the list box, you may need to just run a re-load to set the internal flag that makes everything else below work.
Now, I can create a set expression like this:
Sum({<SalesYear={2009,2010,2011}>} Sales)
And it will only show me the sales for Customer A and C.
I could make this more generic by limiting the SalesYear to the currently selected Years:
Sum({<SalesYear=P({$} Year)>} Sales)
Stephen Redmond is CTO of CapricornVentis a QlikView Elite Partner
Friday 20 May 2011
It's the discovery, stupid!
QlikView is Qool. It looks great. It is easy to create great looking content. It is fantastically easy to create content and distribute to multiple users. What could possibly be bad? I love QlikView, I think it looks great.
I was surprised recently to read Jay Jakosky's blog entry entitled, "Can a humble chart object get some love"
Amazingly, after 5 years working with QlikView, this was the first time that I have heard anyone suggest that QlikView displays are anything but fantastically beautiful. Jay makes some valid points about displays and about how QlikView's competitors do things. The real point is that it's not about the display!
You see, 99 times out of a 100, you don't need to think about displays like these. For the other 1 time, you can probably do it another way - probably a much simpler and more effective way.
It's not about the display. It's not about the bells and whistles. It is about the effective presentation of lots of data in an intuitive and easy to use fashion that users love to use. It is about allowing users to navigate around their data so that they can find real answers to real business problems real quickly.
It's the discovery, stupid!
P.S. I'm not really calling anyone stupid just because they have a different opinion to mine - just paraphrasing the famous Clinton camp slogan from the 1992 US Presidential election.
Stephen Redmond is CTO of CapricornVentis a QlikView Elite Partner
Tuesday 17 May 2011
Rules for creating a Key/Link Table in QlikView
A key/link table is frequently required in QlikView to resolve Synthetic Key or Circular Join issues. It can also help to tidy up a schema that has tables all over the place. The goal is to create a star (and sometimes snowflake) schema with dimension tables connected to a central key table. Unlike in classical data warehousing, the central table doesn't often have the measures - they generally stay in the dimension tables.
There are 3 rules for creating a key table. The first 2 are very straightforward - the last is where you need to use your skill and judgement to create the right result. So, here are the rules:
1. All tables should have a primary key. If a table doesn't have one unique key, derive one using a function like autonumber or autonumberhash256.
2. Break all the existing joins by renaming foreign keys (e.g. in the Orders table, rename CustomerID to O_CustomerID). For a "pure" star schema, there should be no QlikView Associations remaining and all the tables should be standalone. From a pragmatic point of view, it is fine to leave some hierarchical tables associated (e.g. Product to ProductCategory) to have a more "snowflake" schema.
3. Use a mixture of Concatenate and Join to generate the Key table using the Resident data. You will load the previously renamed foreign key with the correct name so that they connect to the right dimension table (e.g. ... O_CustomerID As CustomerID).
For an example, if I have a simple structure with Customer, Calendar, Order, OrderDetail and Product.
Step 1 - Customer, Product, Calendar (DateKey), and Order already have a primary key. In OrderDetail I will create an ID from OrderID and LineNo (we will do a bit of step 2 while we are at it):
...
ProductID as OD_ProductID, // rename product foreign key
...
Step 2 - Customer and Product are not an issue because they don't have a foreign key. I already renamed my foreign keys in OrderDetail so I need to attend to Order:
...
OrderID,
CustomerID as O_CustomerID,
DateKey as O_DateKey,
...
Now all my links will be broken.
Step 3 - Now I load my key table. I will begin with data from the Order table:
Key:
Load
OrderID,
O_CustomerID As CustomerID,
O_DateKey as DateKey,
...
Resident Order;
Now Join in the Product and OrderDetail keys from the OrderDetail table.
Join (Key) Load
OD_OrderID As OrderID,
OD_ProductID As ProductID,
OrderDetailID,
...
Resident OrderDetail;
Now I have a key table which will connect all my detail. I can extend this by Joining or Concatenating additional tables. For example, I could concatenate data from Purchases that also has Date and ProductID information.
Any of the previously renamed foreign keys (e.g. O_CustomerID) can actually be dropped now - their information is encapsulated in the key table so that keeping them is just duplicating data. I might choose to hang onto them for a while, just to test my relations, but best practice will be to remove them.
Stephen Redmond is CTO of CapricornVentis a QlikView Elite Partner
There are 3 rules for creating a key table. The first 2 are very straightforward - the last is where you need to use your skill and judgement to create the right result. So, here are the rules:
1. All tables should have a primary key. If a table doesn't have one unique key, derive one using a function like autonumber or autonumberhash256.
2. Break all the existing joins by renaming foreign keys (e.g. in the Orders table, rename CustomerID to O_CustomerID). For a "pure" star schema, there should be no QlikView Associations remaining and all the tables should be standalone. From a pragmatic point of view, it is fine to leave some hierarchical tables associated (e.g. Product to ProductCategory) to have a more "snowflake" schema.
3. Use a mixture of Concatenate and Join to generate the Key table using the Resident data. You will load the previously renamed foreign key with the correct name so that they connect to the right dimension table (e.g. ... O_CustomerID As CustomerID).
For an example, if I have a simple structure with Customer, Calendar, Order, OrderDetail and Product.
Step 1 - Customer, Product, Calendar (DateKey), and Order already have a primary key. In OrderDetail I will create an ID from OrderID and LineNo (we will do a bit of step 2 while we are at it):
...
AutoNumberHash256(OrderID, LineNo) As OrderDetailID,
OrderID as OD_OrderID, // rename order foreign keyProductID as OD_ProductID, // rename product foreign key
...
Step 2 - Customer and Product are not an issue because they don't have a foreign key. I already renamed my foreign keys in OrderDetail so I need to attend to Order:
...
OrderID,
CustomerID as O_CustomerID,
DateKey as O_DateKey,
...
Now all my links will be broken.
Step 3 - Now I load my key table. I will begin with data from the Order table:
Key:
Load
OrderID,
O_CustomerID As CustomerID,
O_DateKey as DateKey,
...
Resident Order;
Now Join in the Product and OrderDetail keys from the OrderDetail table.
Join (Key) Load
OD_OrderID As OrderID,
OD_ProductID As ProductID,
OrderDetailID,
...
Resident OrderDetail;
Now I have a key table which will connect all my detail. I can extend this by Joining or Concatenating additional tables. For example, I could concatenate data from Purchases that also has Date and ProductID information.
Any of the previously renamed foreign keys (e.g. O_CustomerID) can actually be dropped now - their information is encapsulated in the key table so that keeping them is just duplicating data. I might choose to hang onto them for a while, just to test my relations, but best practice will be to remove them.
Stephen Redmond is CTO of CapricornVentis a QlikView Elite Partner
Thursday 12 May 2011
Part-to-Whole Time Series
I recently talked (here) about using pie charts for Part-to-Whole comparisons. As Stephen Few explains in his excellent article, Displays for combining time-series and part-to-whole, you can't really use pie charts like this in a time-series. It just doesn't work.
Stephen suggests the use of line charts (which are always a good idea for time-series) with one line showing the total and then the "normal" line chart showing how the total is broken down.
So, how do I create this type of chart in QlikView?
The easiest way is just to create 2 charts, one for the total line and one for the split values. This works fine - unless you want to minimize the objects or want to put them in a container control. Then you run into problems.
There are a couple of solutions for this that I have been playing with. The first one, which is more "dynamic" for the values in the dimension, does not always work out great. Here it is:

So, how did I do this?
I have 3 dimensions in this chart. The 2nd and 3rd dimensions are the Year and Category - just as they would be for the normal split out chart. The first is using the ValueList function in QlikView. ValueList creates a pseudo dimension containing, as its values, the list of values that you provide in the function.
My calculated dimension expression is:
=ValueList('Total', 'Categories')
So, I have a dimension that contains 2 values. I then turned on the Trellis function for this dimension which achieves 2 separate charts for Total and Categories.
I then use ValueList again in the expression to test which of the values I am at so that I can use a different expression for each of them:
if(ValueList('Total', 'Categories') = 'Total',
Sum(TOTAL<Year> LineSalesAmount),
Sum(LineSalesAmount))
So, if it is the Category then I just use the simple expression. For the total I use Total to get the same value for each category and hence achieving just one line in that chart (although there are actually 3!).
All very clever but there is one flaw with this. Because of the trellis, the axis are going to be the same height. This means that in the bottom chart, the lines for each category are a bit squashed down in the lower half.
So, another solution. This one is a little more "static" on the values because I need to define an expression for each of the values in the dimension. I am not sure that this is such a problem because, in the "real world", many of these dimensions are quite static anyway.
So, I have a simple chart with Year and Category for dimensions. I have an expression using a set for each of the 3 category values like this:
Sum({<CategoryType={"Footwear"}>} LineSalesAmount)
and one expression for the total like this:
Sum(TOTAL<Year> LineSalesAmount)
So I do something that has been in QlikView for years (so this will work in v8.5 where there is no Trellis). In the "Axes" tab of the chart properties I set the option for the Total expression to appear on the Right Position and then turn on the "Split Axis" option - like this:

This gives me a display pretty much exactly as I wanted:
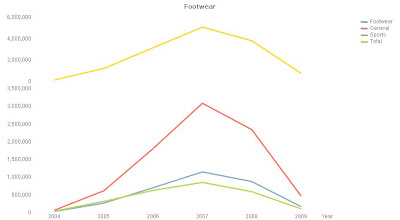
I might tweak the split percentage from the default of 67, but it may not be necessary.
Stephen Redmond is CTO of CapricornVentis a QlikView Elite Partner
Stephen suggests the use of line charts (which are always a good idea for time-series) with one line showing the total and then the "normal" line chart showing how the total is broken down.
So, how do I create this type of chart in QlikView?
The easiest way is just to create 2 charts, one for the total line and one for the split values. This works fine - unless you want to minimize the objects or want to put them in a container control. Then you run into problems.
There are a couple of solutions for this that I have been playing with. The first one, which is more "dynamic" for the values in the dimension, does not always work out great. Here it is:

So, how did I do this?
I have 3 dimensions in this chart. The 2nd and 3rd dimensions are the Year and Category - just as they would be for the normal split out chart. The first is using the ValueList function in QlikView. ValueList creates a pseudo dimension containing, as its values, the list of values that you provide in the function.
My calculated dimension expression is:
=ValueList('Total', 'Categories')
So, I have a dimension that contains 2 values. I then turned on the Trellis function for this dimension which achieves 2 separate charts for Total and Categories.
I then use ValueList again in the expression to test which of the values I am at so that I can use a different expression for each of them:
if(ValueList('Total', 'Categories') = 'Total',
Sum(TOTAL<Year> LineSalesAmount),
Sum(LineSalesAmount))
So, if it is the Category then I just use the simple expression. For the total I use Total
All very clever but there is one flaw with this. Because of the trellis, the axis are going to be the same height. This means that in the bottom chart, the lines for each category are a bit squashed down in the lower half.
So, another solution. This one is a little more "static" on the values because I need to define an expression for each of the values in the dimension. I am not sure that this is such a problem because, in the "real world", many of these dimensions are quite static anyway.
So, I have a simple chart with Year and Category for dimensions. I have an expression using a set for each of the 3 category values like this:
Sum({<CategoryType={"Footwear"}>} LineSalesAmount)
and one expression for the total like this:
Sum(TOTAL<Year> LineSalesAmount)
So I do something that has been in QlikView for years (so this will work in v8.5 where there is no Trellis). In the "Axes" tab of the chart properties I set the option for the Total expression to appear on the Right Position and then turn on the "Split Axis" option - like this:

This gives me a display pretty much exactly as I wanted:

I might tweak the split percentage from the default of 67, but it may not be necessary.
Stephen Redmond is CTO of CapricornVentis a QlikView Elite Partner
Wednesday 11 May 2011
Alternative to Null
There are lots of Null values floating around in data and QlikView has some interesting ways to deal with it.
For example, we can turn on the NullAsValue option for a field that we are going to load:
NullAsValue A, B;
Any values that were previously Null (and do not display in a list box) will now display as blank strings.
There is a small problem when I want to do any maths on a field that might have a Null value and that is that any number plus Null is Null. A great way to deal with this is, if I expect there might be Null values in a field, to use the Alt() function.
Alt accepts a list of values and will return the first of those values that has a valid number. So, instead of:
Load A+B as AB, ...
I can have:
Load Alt(A,0)+Alt(B,0) As AB, ...
Now, if either A or B have a Null value, it is treated as zero and my calculation can continue and give a good result.
Stephen Redmond is CTO of CapricornVentis a QlikView Elite Partner
Thursday 21 April 2011
Better BI Dashboards
In CapricornVentis, we've been delivering great business discovery solutions in QlikView for several years now. QlikView really helps you build great user interfaces that help people interrogate their data in new ways that they have never thought of before.
Before QlikView, much of my "Dashboard" design work would have been in SalesLogix CRM where we plugged various chart controls into the CRM data to display information such as Sales Pipeline, Performance, etc. Similar things can be achieved with Oracle CRM On Demand Analytics.
No matter what system you use - BI, CRM, Database, you probably have access to some wonderful tools that allow you to present data to users in lots of different ways.
"What do you want to see on your dashboard", says the chart designer. "Everything", says the customer. "OK", says the designer.
Stop! "Everything" is the wrong answer when it comes to dashboard design.
Think of your car dashboard. It doesn't tell you everything that is happening in your car. It does tell you everything that you need to know, right now, to drive your car.
Think about it. Many car dashboards don't include a clock. A clock is a "nice to have" on a dashboard - it isn't critical to the running of the vehicle.
A "pure" car dashboard probably needs to have only 3 things - a speedometer, a fuel guage and an oil temperature guage. Someone might argue that a tachometer is useful because it lets me know if I am over-revving the engine and also lets me know when is the best time to change gear. We could have the argument but lets just add it in. So, 4 things. Everything else is "nice to have" and you don't need it.
There are other things that I need to know about to run my car. I need to know that my oil levels are good. I need to know that my brake fluid is in between min and max. These are things that I should check every week or so - but I don't need to know about them right now as I drive this car.
It is the same with the business dashboard.
What do you need to know, right now, to run your business?
Stephen Redmond is CTO of CapricornVentis a QlikView Elite Partner
Wednesday 20 April 2011
Improve load performance by writing better script!
I came across a document recently where a date was being loaded from a text field in YYYYMMDD format. The developer had used left, right and mid functions along with MakeDate to parse the date.
This is something that I might have done myself several years ago - before I knew better. I wondered to myself if there would be much of a load speed differential between this method and Date# - which is the method that I would use today. So I did some testing.
This particular machine was running v9 so it could have used some load speed tweaking. I took a data set of 3 million records and compared both using the two methods. The left, right, mid method took about 2 minutes (not a fast machine). The Date# method was under 1:30 - 3/4 the time for the other method.
I wonder if you went back and reviewed some of your old code, if you might speed it up a little by just doing things better, just because you now know better.
Stephen Redmond is CTO of CapricornVentis a QlikView Elite Partner
Monday 18 April 2011
Blocking user access to a field using OMIT
This is something that comes up every so often. A question like, "we have sensitive data (such as salary!) in our system that we only want some users to see".
This is all very straightforward on SBS where collaboration is not available. Simply lock down the tab which has the sensitive data displayed using, for example, a condition based on the OSUser() function.
On an Enterprise server, where users can create their own objects, you don't want them to even see that the field is there.
We can achieve this using the OMIT field in Section Access. At a simple level, if you only have one field to hide, you can have the OMIT in the main Section Access table. If you want to perhaps OMIT several fields, then the creation of a group of fields is the thing to do and then just link the user to the group ID.
In the example below, when user1 logs in they will not see Field1 or Field2. When user2 logs in, they will not see Field2 or Field3.
Section Access;
LOAD * INLINE [
ACCESS, USERID, OMITGROUP
ADMIN, admin,
USER, user1, group1
USER, user2, group2
];
LOAD * INLINE [
OMITGROUP, OMIT
group1, Field1
group1, Field2
group2, Field2
group2, Field3
];
Section Application;
Fields:
LOAD * INLINE [
Field1, Field2, Field3, Field4, Field5
Value1, Value2, Value3, Value4, Value5
];
Stephen Redmond is CTO of CapricornVentis a QlikView Elite Partner
Friday 15 April 2011
Defending Pie Charts!
Anyone who knows me (in the BI world) knows that I have a certain lack of respect for the humble Pie chart. I am supportive of Stephen Few's idea that we should, in general, Save the Pies for Desert.

A Pie chart, as it ubiquitously appears in many presentations, used to compare one value against several others, is a very poor choice for the task. A simple bar chart is by far the better choice for the job.
I have been quite happy, up till now, to reject any use of a pie chart for any purpose. That was until I came across Robert Kosara's blog entry, In Defence of Pie Charts. Robert discusses Spence and Lewandowsky's study which shows that pie charts were interpreted more accurately than bar charts in some circumstances.
So, perhaps there is a good use for the Pie chart after all - not in comparison of multiple values, but in simple part-to-whole comparison.
Take, for example, the following Pie chart where we are comparing the performance of Germany versus all other countries.

Now, this chart doesn't give me any numbers but what it does give me is an intuitive feel for how much of the market Germany has.
Now, compare that to an equivalent bar chart.

Here we have a perfectly formed bar chart where we can get a good grasp of the numbers that are involved. However, if I want to get an idea of what percentage the German total is versus the whole, I have to do a little more work to get the answer - I can't intuit it.
So, for this specific purpose, a Pie chart might be a better choice than the bar.
These charts are easily achieved in QlikView using implicit set analysis (available since version 9).
The chart has no dimension but has 2 expressions. In my case, the expressions are:
Stephen Redmond is CTO of CapricornVentis a QlikView Elite Partner

A Pie chart, as it ubiquitously appears in many presentations, used to compare one value against several others, is a very poor choice for the task. A simple bar chart is by far the better choice for the job.
I have been quite happy, up till now, to reject any use of a pie chart for any purpose. That was until I came across Robert Kosara's blog entry, In Defence of Pie Charts. Robert discusses Spence and Lewandowsky's study which shows that pie charts were interpreted more accurately than bar charts in some circumstances.
So, perhaps there is a good use for the Pie chart after all - not in comparison of multiple values, but in simple part-to-whole comparison.
Take, for example, the following Pie chart where we are comparing the performance of Germany versus all other countries.

Now, this chart doesn't give me any numbers but what it does give me is an intuitive feel for how much of the market Germany has.
Now, compare that to an equivalent bar chart.

Here we have a perfectly formed bar chart where we can get a good grasp of the numbers that are involved. However, if I want to get an idea of what percentage the German total is versus the whole, I have to do a little more work to get the answer - I can't intuit it.
So, for this specific purpose, a Pie chart might be a better choice than the bar.
These charts are easily achieved in QlikView using implicit set analysis (available since version 9).
The chart has no dimension but has 2 expressions. In my case, the expressions are:
Sum({<Country=P({$})>} LineSalesAmount)
and
Sum({<Country=E({$})>} LineSalesAmount)
When I select one or more countries, the first expression will give me the total for the selected countries. The second expression gives me the reverse, the total for all the other values.
The labels for these can be achieved using Concat. For the selected countries:
='Selected: ' & Concat(DISTINCT Country, ', ')
For the other countries:
='Others: ' & Concat({} DISTINCT Country, ', ')
Stephen Redmond is CTO of CapricornVentis a QlikView Elite Partner
Thursday 14 April 2011
Data for Humans
I am a great fan of Stephen Few. Any of his books are worth reading for anyone who works in the data visualization space.
If you can't get a copy of one of his books right now, then 5 minutes reading his article, "Data Visualization for Human Perception", is a great introduction. The commentaries by Ronald Rensink, Naomi Robbins and Robert Kosara are equally worth reading.
My belief is that the study of human perception to create great data visualization is fantastically interesting. There is some fascinating research going on in the area of pre-attentive processing.
As computers get more powerful and the cognitive psychologists keep going with their ground-breaking research, we really are entering a golden age. I look forward to being a part of it.
Even so, I have a feeling that we will still be using the humble bar chart for many years to come. It is such an intuitive and simple visual data display method. I wonder if the real breakthroughs will, in fact, be in enabling people to work more collaboratively with their data to discover new insights.
Stephen Redmond is CTO of CapricornVentis a QlikView Elite Partner
Best practice on iPad user interface design
Thanks to Colin Hancox, who pointed me to this article on the QlikView Blog by Chris Mabardy, Director of Product Marketing at QlikView.
http://community.qlikview.com/blogs/theqlikviewblog/archive/2011/04/13/best-practices-for-qlikview-ipad-user-interface-design.aspx
The new mobile platform coming out in QV10 SR2 is new to all of us so it is great to have good guidance on building apps.
In general, all your old applications will work on the mobile platform. The main considerations for iPad are screen real-estate (1024x768) and gestures instead of mouse. If you expect that users will want access to right-mouse features, you need to turn on the new "Menu" icon in the caption.
After that, you just follow good design principals for screen layout. If you haven't already come across it, I recommend Stephen Few's perceptualedge.com and any of Stephen's books.
Stephen Redmond is CTO of CapricornVentis a QlikView Elite Partner
Your call...Qlikview Server and AccessPoint
I would like to learn more about Qlikview Server and AccessPoint.
A brief guide to QlikView Server (QVS). It is worth noting that the QVS Reference Manual is really good now and explains the specifics of this subject really well.
So, QlikView Server is a version of QlikView that runs on a server! Simple, eh? QVS will load documents into memory on the server. When a client connects, QVS will send enough information to that clients so that they can display the information on their screens. When the client makes a selection, QVS uses the memory and CPU power of the server to process that selection and then sends the screen updates to the client. This means that the client doesn't require to have enough memory and CPU to handle large volumes of data and complex calculations - hence why simple clients such as iPhone and iPad work so well. The client just needs enough CPU and memory to render the screens.
QVS only loads each document once. As each client connects, QVS will apportion them a separate area of memory to handle their data requirements (mostly cache of charts). A "rule of thumb" is that each client will require and additional 10% of the document's memory requirement. So if the document loads into 1GB of memory on the server, each client will require approx. 100Mb of additional memory. As each version of QlikView has been released, their memory handling technology has got better and better and v10 will handle many more clients in the same memory than, say, v8.5.
There are now just 3 main client types (previous versions supported a Java client also). First, QlikView Desktop can be used as a client to access documents from a server. When used as a client, you would notice that buttons such as "Save" and "Reload" are disabled because they make no sense for a client - the server will handle all of that.
The second client is the QlikView plugin for IE. This is an ActiveX plugin that sits inside Internet Explorer. It shares the same code base as QlikView Desktop so the experience is very similar. It is still a "thick" client so does require installation - although it comes with an MSI for automated installation.
The third, an easiest to deploy, is the AJAX client. This doesn't require any installation because it works within a browser such as IE, Firefox, Chrome, etc. As of QlikView 10 SR2, it is also supported in mobile devices such as Safari for iPad using HTML5.
The majority of Plugin or AJAX end users will access their documents via AccessPoint. AccessPoint, by default, takes a user's Windows Authentication information and will be able to present to them all of the documents that they have access to. This means users won't be confused by seeing documents that they won't be able to open. Users can also set "favorites" in AccessPoint so that they can default to seeing their most used documents.
Windows security is the default for QlikView server but not the only method available. By turning on QlikView's DMS authentication (not available in Small Business Server), the task of authenticating the users can be given to any other type of directory service or even a completely custom form.
Stephen Redmond is CTO of CapricornVentis a QlikView Elite Partner
Tuesday 12 April 2011
Your call...
I am training in some QlikView newbies right now and it makes me really aware about the huge number of things that you can learn in QlikView.
Please feel free to comment below and tell me what feature of QlikView you are interested in learning more about and I can use your comments as the basis for future posts.
Stephen Redmond is CTO of CapricornVentis a QlikView Elite Partner
Please feel free to comment below and tell me what feature of QlikView you are interested in learning more about and I can use your comments as the basis for future posts.
Stephen Redmond is CTO of CapricornVentis a QlikView Elite Partner
Wednesday 6 April 2011
Load testing QlikView with JMeter
Another really interesting session that I attended at Qonnections was on scalability. Here, we looked at using the JMeter tool (an open source product from Apache: http://jakarta.apache.org/jmeter/) to first record a set of interactions and then play them back multiple times with multiple sessions.
This is a really powerful tool. Not just for QlikView but for anyone developing web products.
I can't record all the steps here, but there is a tutorial document and some sample files available from the Community page @ http://community.qlikview.com/groups/qlikview-scalability/forum/default.aspx
Stephen Redmond is CTO of CapricornVentis a QlikView Elite Partner
Subscribe to:
Posts (Atom)